From Z-Scores to MongoDB Indexes: Building a Real Football Scouting Platform
Building scouting software sounds straightforward on the surface—player lists, filters, rankings—but building it for real usage reveals a harder set of problems: statistical models that need to be both correct and efficient, UI complexity that comes from analysts tweaking dozens of numeric parameters at once, and database queries that can easily grind to a halt under the weight of large datasets and heavy filtering.
The project had three main engineering challenges. First, the frontend: analysts managing complex state across multiple screens and working with large tables of data. Angular 19 with standalone components turned out to be the right tool for that level of complexity—but the real value came from specific Material and CDK features that directly solved real problems.
Second, the domain logic: understanding how football analysts actually think. Z-scores aren't just a formula to implement; they matter only in context. Why does relative scoring matter when comparing a left-back in the Scottish Championship to one in a stronger league? How do you weight defensive stats against attacking stats? And how do you build product features that let domain experts encode that knowledge in a way that feels natural to them?
That part was especially interesting to me because it pushed me beyond the usual frontend mindset and into the actual reasoning behind how players were being evaluated. It meant building a scoring pipeline that worked with the analysts' mental model rather than against it.
Third, performance: the first time I saw one of the heavier searches taking around 22 seconds, it was clear the initial implementation wouldn't survive real usage. That slowdown came from multiple angles at once—heavy filtering across dozens of fields, repeated Z-score calculations, and the sheer volume of data to process.
Fixing it meant rethinking the query strategy, MongoDB indexing, and the caching layers that keep score recalculation work out of the request path.
Why Angular Was the Right Tool for the Job
A scouting platform is not a marketing site. It's a dense internal tool where users are managing state across multiple screens, fine-tuning numeric filters, and analyzing large tables of data.
Reaching for a lightweight framework would have meant stitching together fragments of libraries for routing, state management, and forms—and then dealing with them all disagreeing on conventions.
Angular's structured ecosystem solved this upfront. Standalone components in Angular 19 gave the UI clear boundaries and made it easy to keep the codebase predictable as complexity grew. But the real advantage was in the specific Material and CDK tools that solved real problems:
Virtual scrolling for the player lists. A full result set can be 400+ players, but rendering all of them would make the browser choke. Angular's CDK virtual scrolling made it so only the visible 30–40 rows render at any time, keeping the browser smooth even with a thousand-player table.
Drag-and-drop in the formation builder. Scouts manage tactical formations by dragging players into slots. The CDK drag-drop library handled all the event logic, copy-vs-move detection, and drop-zone validation. Without it, that's a half-day of event-bubbling bugs.
RxJS Subject debouncing for multi-filter search. When a user adjusts sliders across a dozen statistical fields, you can't fire a new search on every keystroke or the backend gets hammered.
RxJS's debounceTime and distinctUntilChanged let me combine asynchronous streams in a way that felt natural—no manual timers, no race conditions, no over-fetching. The RxJS pipeline made the search feel responsive while protecting the backend from thrashing.
The Scoring Pipeline
To understand the scouting platform, you need to understand how player scores are computed. It's not a single formula; it's a pipeline that takes domain logic into account at each step.
Here's the conceptual flow:
To make this concrete: say a scout wants to find a ball-winning midfielder. They create a profile targeting DM/CM positions and weight defensive attributes—Defensive Duels, Aerial Duels, Interceptions—higher than everything else. The profile builder shows each stat's share of the total weight, so the scout can see exactly how their priorities translate into the scoring model.
Once the profile is saved, the scout switches to Player Search and selects it. The pipeline runs—filtering by position and minutes, computing Z-scores, applying the profile's weights, adjusting for league difficulty—and the table updates with 792 players ranked by their weighted Z-score. The top results are players who match that specific defensive profile, not just players with high raw stats.
Here's why each step matters:
The 500-minute filter prevents unreliable statistics. A player with 5 shots won't have a meaningful expected goals number, and including them would noise up the scoring. Filtering to players with at least 500 minutes played ensures the cohort is statistically sound.
Per-stat mean and standard deviation are computed on that filtered cohort. A player's Z-score for a given stat tells you how far they are from the cohort average, measured in standard deviations.
This is crucial for fair comparison: a center-back who intercepts 4 times per 90 looks very different when you know the cohort average is 2.1 versus 3.8. Z-scores make players within a position peer group directly comparable, even if their raw stats look different.
The Opta adjustment step (which comes later in the pipeline) then handles league difficulty, so a strong performer in a tougher league gets credit for that context.
Inverting "bad stats" is domain-aware engineering. Fouls, yellow cards, and goals conceded are things you want to minimize, but Z-score calculations assume "higher is better." Multiplying these by -1 ensures the scoring system works intuitively.
Weighting is where scouts encode their judgment. The profile builder lets analysts assign numeric weights (with 0.1 increments for fine-grained control) across 9 categories: Passing, Crossing, Shooting, Defending, Dribbling, Goalkeeping, Set Pieces, Attacking, and Discipline.
A scout looking for a defensive midfielder might weight Defending heavily and Shooting lightly. A scout looking for a fullback might weight Crossing and Defending equally.
League and team difficulty adjustment is subtle but important. Using Opta power rankings, the system adjusts raw Z-scores so that a player performing well in a stronger league gets credit for that difficulty. This is the kind of detail that separates a toy project from something analysts actually trust.
Solving the Performance Problem
As the platform grew, performance became a real issue. With complex filters, custom weights, sorting, and a large dataset, some searches were taking around 22 seconds. The first time I measured a path like that end to end, it was obvious the UI could look polished while the system underneath was still buckling.
To fix it, I treated query performance as a first-class design problem. I analyzed real query patterns and added 27 targeted MongoDB indexes—compound and text indexes aligned with the heaviest filters and sorts—not a blanket "index everything" pass. What mattered was what actually showed up in slow logs:
- Compound indexes on position + minutes played, position + league, and other high-traffic filter combinations
- Text index on name and team for quick player lookup
- Individual indexes on age, height, and the detail filters scouts use every day
Query optimization. Bigger payloads also hurt: I switched to Mongoose's .lean() to skip document hydration, which cut serialization time on the initial player load by about 40%.
The 500-minute eligibility filter I described earlier is both a correctness guard and a performance win—it shrinks the cohort before Z-score work runs.
Caching and scoring work. Recalculating relative Z-scores on the fly for every request was the other major cost. I introduced a multi-layer caching strategy so heavy work moved off the hot path and onto indexed reads and precomputed fields:
- In-memory cache: a JavaScript Map with 5-minute TTL and LRU eviction (max 50 entries), for repeated searches in a short window
- Persistent cache: precomputed per-profile Z-scores stored on each player document via MongoDB
bulkWritein batches of 1,000; when profile weights change, a version string invalidates stale scores
That architectural shift brought the slowest searches down from about 22 seconds to roughly 3–4 seconds. For context, a typical paginated search with sorting—with a warm cache and a profile selected—now finishes in about 1.1–1.8 seconds. It felt like a real turning point: the platform finally behaved like the kind of tool it was meant to be.
Are heavy searches killing usability in your product? I profile MongoDB workloads, tighten indexes, and keep complex filters fast in production—see full-stack web development for how I engage on builds like this.
Conclusion
This project sat at the intersection of three things: product structure, domain understanding, and performance.
Angular gave the platform a clear, maintainable foundation and specific tools (CDK virtual scrolling, drag-and-drop, RxJS debouncing) that solved real UI problems rather than just being "nice to have."
Working with analysts meant understanding not just what Z-scores are, but why they matter in context—how to adjust for league difficulty, which stats to invert, when to filter for sample size. The performance work was a reminder that even strong features don't matter if the system is too slow to use comfortably.
For me, this was a clear example of what real engineering often looks like: understanding how people work, translating that into software, and making sure the result is fast enough to be useful in practice.
For a deeper look at the full platform—formation builder, shortlisting, Wyscout data ingestion, deployment—see the Raith Rovers scouting platform case study.
Related posts

Slashing AWS Costs by 70%: From 80+ Lambdas to 15 Without Breaking Scale
April 2026•11 min readOne production SaaS had 80+ route Lambdas behind API Gateway; reshaping around domain boundaries cut that infrastructure slice ~70%, steadied latency, and gave the team fewer deployables to babysit. Read the architecture breakdown.
5 Mistakes Teams Make When Moving to Next.js (And What Actually Matters)
March 2026•6 min readTeams move to Next.js expecting SEO and speed fixes—often the friction was never stack-deep. Learn what actually breaks migrations and what fixes them.
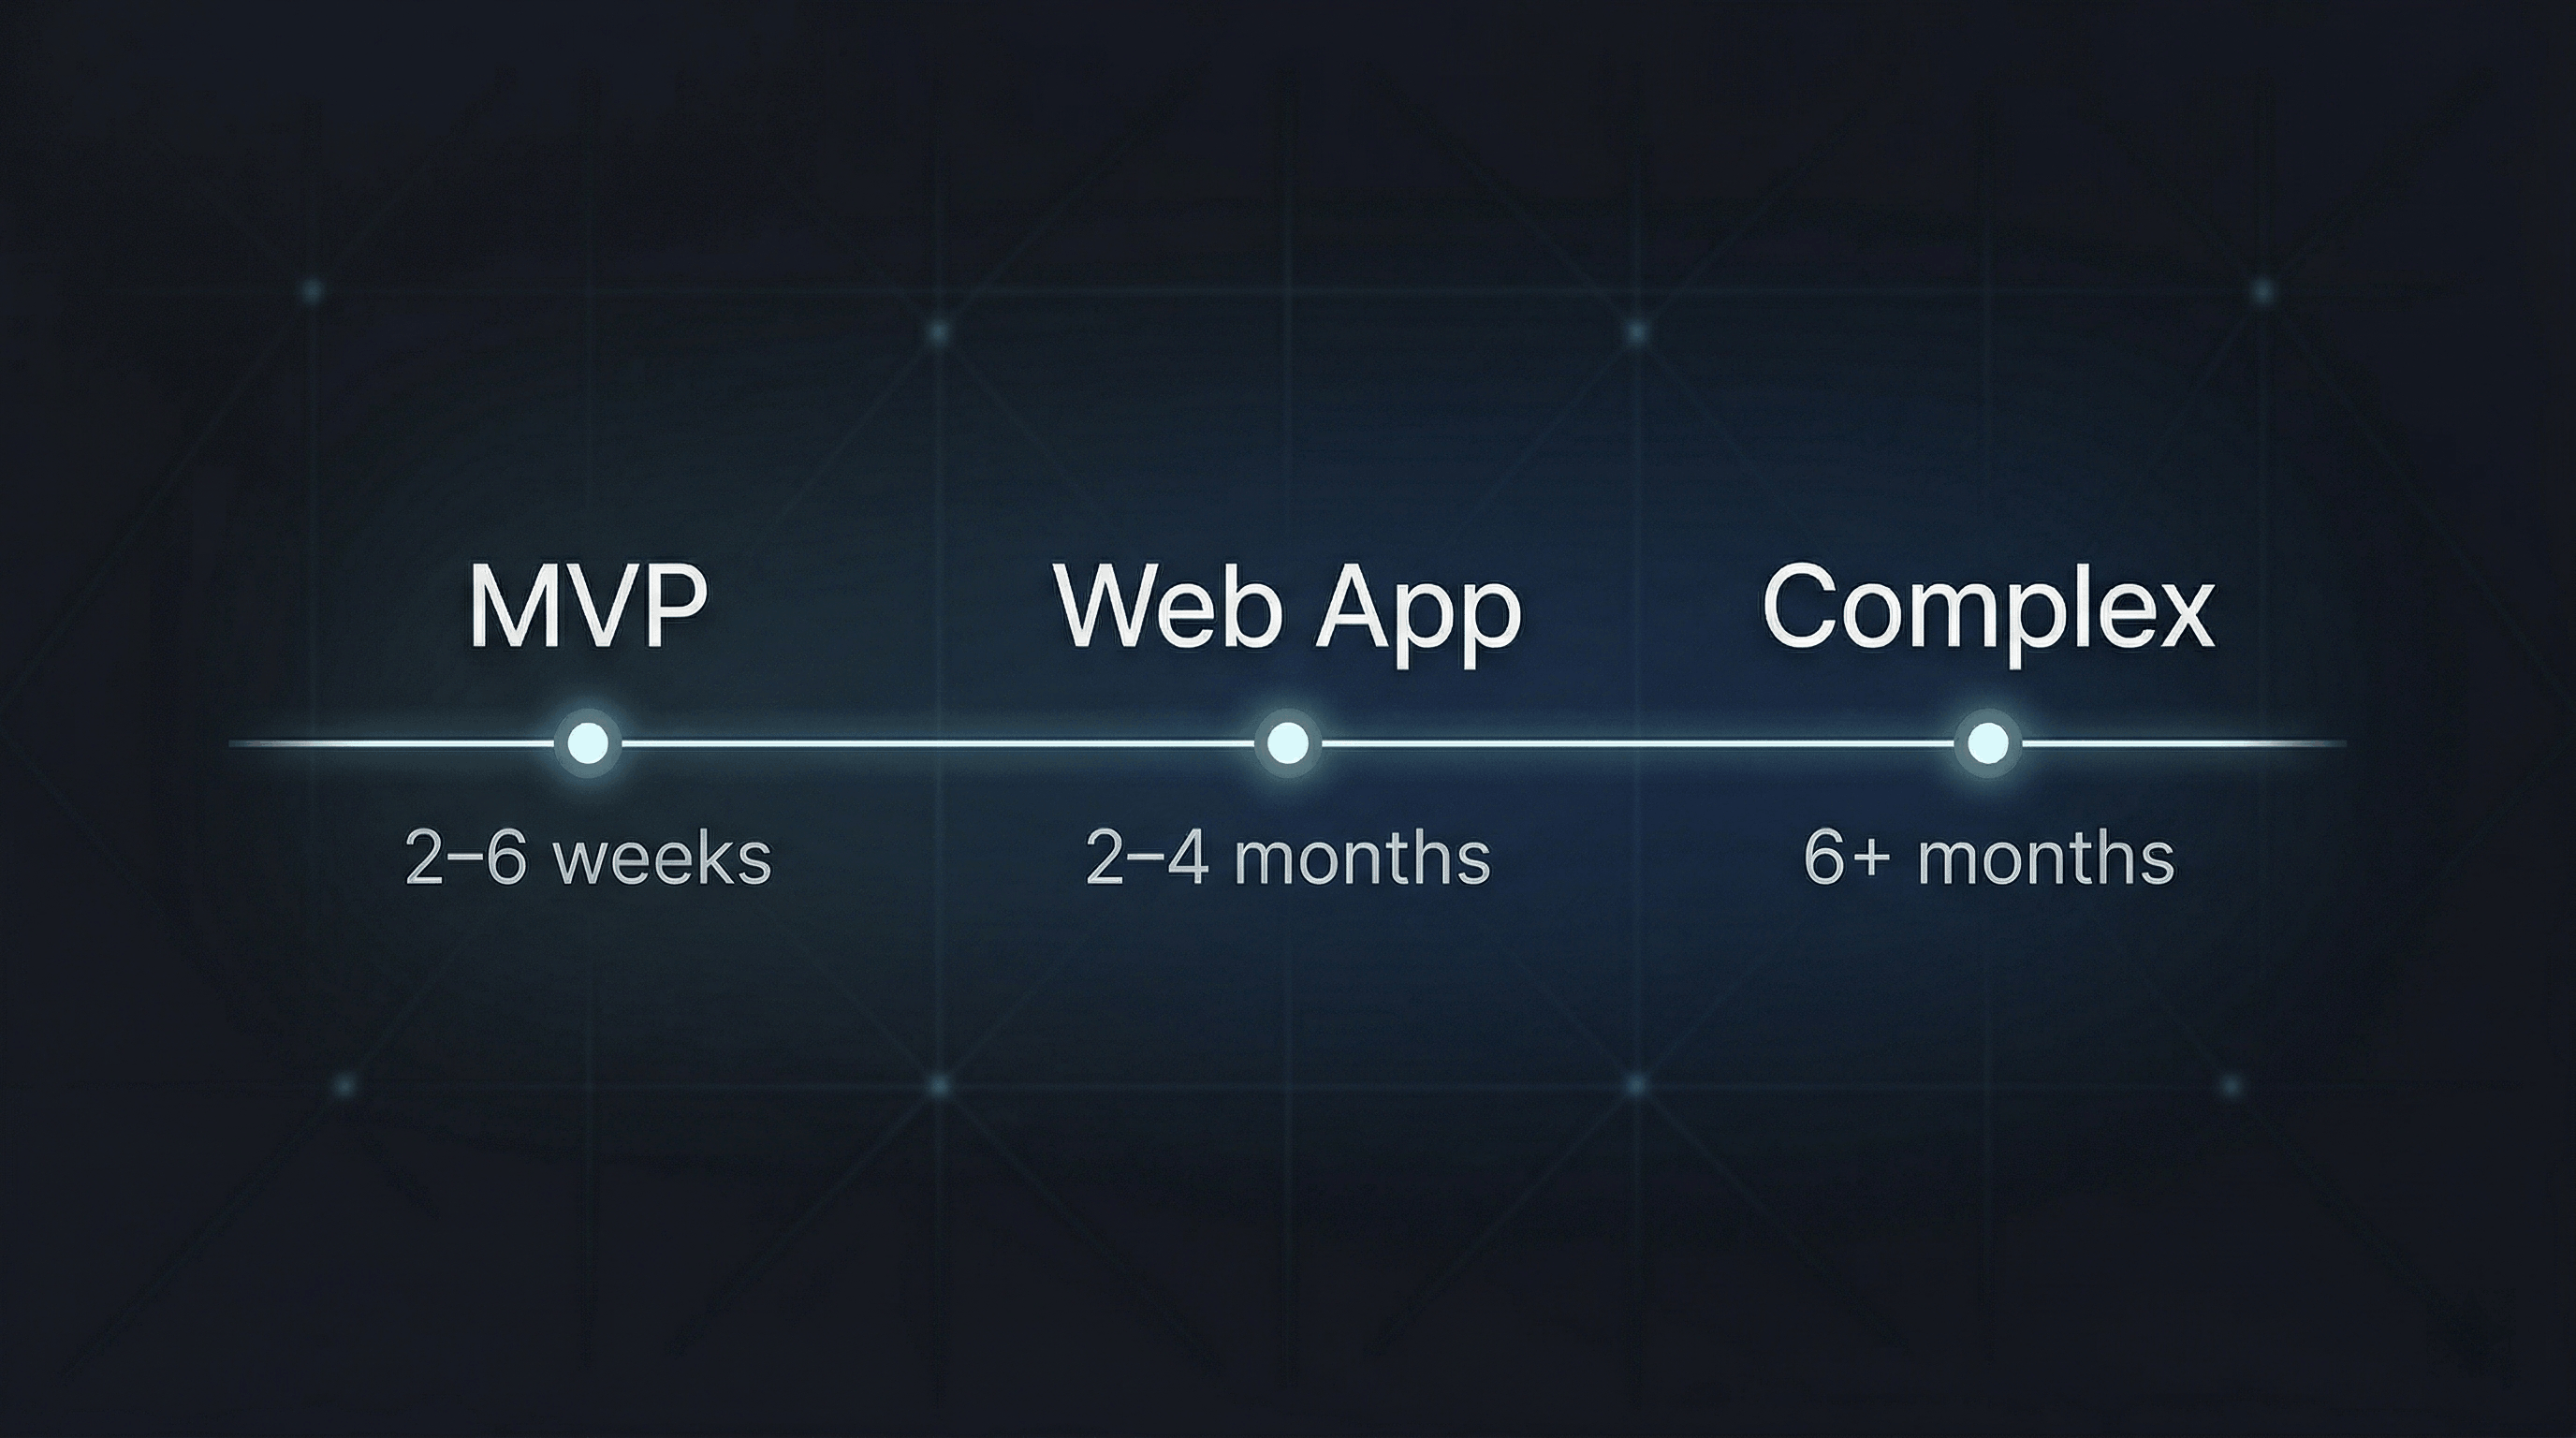
How Long Does It Take to Build a Web Application? (Real Timelines + Hidden Delays Explained)
January 2026•7 min readReal 2026 timelines: MVPs in weeks, solid web apps in months, complex platforms often 6+. Understand what actually stretches calendars—not typing speed—before you commit months of work.
Questions about something you read here, or a project you want to move forward? I work with teams on full-stack builds, AWS and serverless consolidation, migrations, and messy systems.
Contact me